
Most CFOs have one specific objection to branded merchandise: “Show me the numbers, not the vibes.”
Digital ad costs are rising and attribution is noisy, yet physical branding gets cut because it lacks a defensible spreadsheet. I have seen this data gap kill high-potential campaigns during sourcing reviews dozens of times.
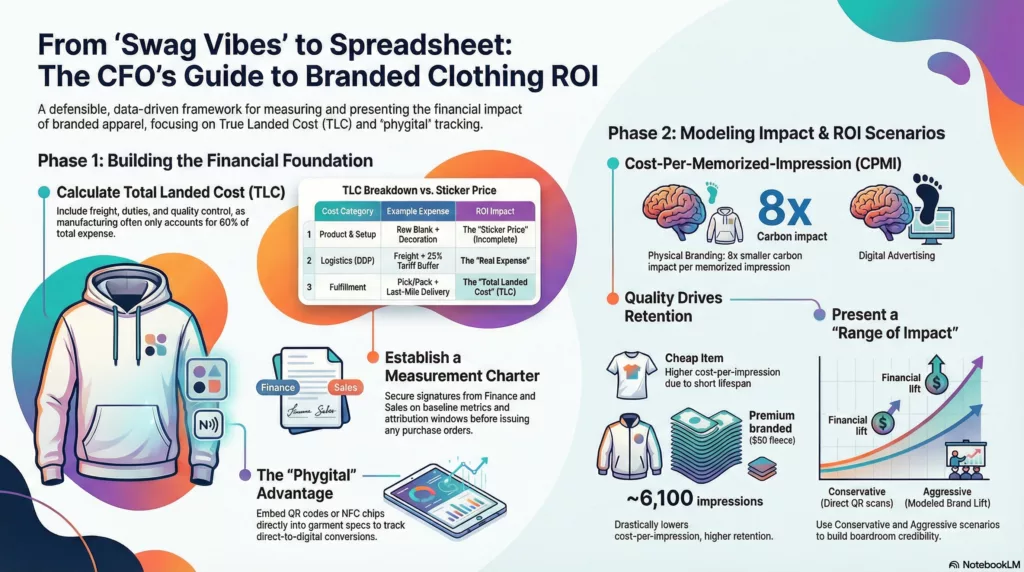
You must frame clothing as a depreciating asset. This approach allows you to calculate the roi of promotional products using three metrics:
- True Landed Cost: Total cost per delivered unit.
- Cost-per-Memorized-Impression (CPMI): The efficiency of brand recall.
- Pipeline ROI: Direct revenue via Phygital QR or NFC tracking.
The sustainability data supports this shift. A 2026 PPAI-ASI study reports that promo’s carbon impact per memorized impression is 8x smaller than digital.
This is a scenario-based model rather than a single magic number. Before Step 1, assemble your inputs to avoid fighting about assumptions later.
What You Need Before Calculation
Estimated Time: 30 Minutes | Difficulty: Intermediate
I refined this checklist across hundreds of global sourcing projects. A vague input here guarantees a rejected proposal later. Do not estimate these numbers; get quotes.
- Procurement Data: You need the exact landed cost for your custom promotional clothing, including decoration and kitting fees.
- The Tool: Use Google Sheets or Excel as your primary modeling tool.
- Logistics Reality: Confirm your Incoterms. I strongly recommend using DDP (Delivered Duty Paid) inputs. If you calculate ROI on FOB prices and miss the ~25% tariff and freight costs, your model fails immediately.
- Access: Ensure read access to GA4 (for baseline site sessions) and HubSpot/Salesforce (for current SQL rates).
- Tracking Assets: Define your UTM naming convention and generate unique QR codes for attribution.
- Privacy: If using QR/NFC tracking, you must disclose data collection to satisfy GDPR/CCPA.
- Sustainability: Validate eco-claims against the 2026 PPAI-ASI carbon efficiency study. Verify apparel fabric types carry GRS or GOTS certifications.
- Product Safety: For U.S. distribution, demand a Prop 65 compliance statement for all inks and dyes.
🧠 Expert Take: I always keep theASI Ad Impressions Study open in a second tab. It provides the industry-standard CPI (Cost Per Impression) data you need to benchmark your physical campaign against digital channels.
Step 1: Create a "Measurement Charter" (Workshop)
Before you issue a purchase order, host a 30-minute alignment workshop with Sales and Finance. Your objective is to produce a Measurement Charter —a boring, specific one-page document that prevents the common "Brand Awareness vs. Hard Sales" argument later.
1. Select Your Headline Metric Pick one primary model for reporting. In our experience, mixing these models confuses stakeholders and dilutes the results.
- Primary Path (B2B Pipeline): Track the lead from physical delivery to SQL > Closed-Won. This is best for long sales cycles.
- Alternative Path (Direct Revenue): Track immediate purchases via unique promo codes. This is best for self-serve e-commerce.
2. Lock in Attribution Windows Define the specific "influence" period. If a prospect converts 60 days after receiving a hoodie, does it count?
- Low-Cost Items: Set a 30-day window for consumables like pens or notebooks.
- High-Value Items: Set a 90-day window for premium corporate outerwear. We find these items stay in rotation—and influence sentiment—significantly longer than cheap swag.
3. Record the Baseline You need a control number to prove lift. Navigate to GA4 > Reports > Acquisition > Traffic acquisition. Record the organic conversion rate for your target segment over the last 90 days.
- A written definition for "Incremental" and "Attributed."
- A baseline table (last 30–90 days).
- Signatures from Finance and Sales. (If they don't sign it, they will dispute the data later).
Step 2: Build a ‘Total Landed Cost (TLC)’ Table
Stop using the "sticker price" for your calculations. In my experience, the manufacturing unit cost is often only 60% of the real expense. To accurately forecast the ROI of promotional products, you need a denominator that Procurement can audit.
Open your spreadsheet and create a tab named TLC_Calc. Do not group these costs; list them individually to expose inefficiencies.
Add these specific line items to your cost stack:
- Product: The raw blank cost plus decoration setup fees (screens, digitizing). Review custom promotional clothing specs to estimate material costs accurately.
- Sampling: Pre-production proofs plus international air shipping (often $50–$150 per round).
- Packaging: Polybags, size stickers, and labor. Effective promotional clothing marketing relies on unboxing, so include gift note costs here.
- Freight: International shipping, fuel surcharges, and domestic last-mile delivery.
- Duties: Check the Official USITC Tariff Database for rates. If you lack the exact code, add a 25% risk buffer line.
- Quality Control: Third-party inspection fees (AQL 2.5) and a 3% waste allowance for defects.
- Fulfillment: 3PL receiving fees, pick/pack labor, and storage.
The Direct Sourcing Gap If you switch from a domestic distributor to direct sourcing, your model changes. A distributor provides a single, marked-up invoice. Direct sourcing splits this into Product, Freight, and Duty rows. You must capture these separate invoices to prove that the extra logistical effort yielded a lower TLC per unit.
Verification: Your "Total Campaign Cost" (Sum of TLC × Units) must match your actual bank wire transfers within 5%. If your spreadsheet says $10,000 but Finance wired $14,000, you likely missed customs broker fees.
Step 3: Model Impressions and CPI Scenarios
Stop guessing. Finance teams reject "magic ROI" numbers. You must build a defendable range anchored in published data to show exactly how physical durability translates to media value.
1. Input Your Usage Scenarios Create three columns in your spreadsheet: Conservative, Likely, and Aggressive. Populate these using benchmarks from the ASI Ad Impressions Study, but adjust for physical quality:
- Conservative: Short retention. Assume the fabric pills after five washes or becomes "pajama-wear" (e.g., ~500 lifetime impressions).
- Likely: Standard retention. A quality jacket generates ~6,100 lifetime impressions; a t-shirt generates ~3,400.
- Aggressive: Premium retention. This assumes you sourced heavyweight fleece with custom embroidery that remains crisp for years in high-visibility contexts like airports.
2. Calculate Cost Per Impression (CPI) Calculate Total Impressions (Units Distributed × Impressions per Item). Then, divide your Total Landed Cost (from Step 2) by this number to determine your true CPI.
3. Calculate the '2026 Metric' (CPMI) Add a row for Cost-Per-Memorized-Impression (CPMI). Use this to align with your Sustainability Lead. A joint PPAI-ASI study confirms that promotional products have a carbon impact per memorized impression that is 8x smaller than digital ads.
Step 4: Implement 'Phygital' Tracking Before Production
![]()
Embed tracking triggers directly into manufacturing specs before the factory cuts the fabric. You cannot calculate the ROI of promotional products if you cannot track the interaction, and retrofitting inventory is impossible.
1. Select Your Tracking Hardware
- Standard (QR Codes): Place a 1.5cm x 1.5cm code on a hem tag, sleeve patch, or inside neck label. In my experience, these locations maintain design aesthetics while ensuring the code remains scannable.
- Premium (NFC Chips): Use Near Field Communication (NFC) for a "tap-to-open" experience.
- Note: Always print a fallback QR code next to the chip. I have found that thick phone cases often block NFC signals, leaving users stranded without a visual backup.
2. Configure the Digital Destination Direct codes to a specific landing page using strict UTM parameters. Use the official Google Campaign URL Builder to generate links with a naming convention like campaign_item_audience_month. This data granularity allows you to distinguish traffic from your promotional clothing marketing efforts versus general organic search.
3. Enforce Privacy Protocols ⚠️ Warning: Do not store personal data (like employee IDs) directly in the QR string. Link to a generic, controlled URL with a clear privacy disclosure. We have seen campaigns halted by legal compliance teams because the physical item lacked a digital "consent to track" mechanism.
4. Execute the "Wrinkle Test" Before mass production, verify the code works on flexible materials:
- Print the QR code draft on paper.
- Crumple it thoroughly.
- Scan it in low-light conditions.
If the camera struggles, the code is too dense. Use a URL shortener to reduce the character count. Fewer characters result in fewer dots, significantly improving readability on fabric.
Step 5: Generate the "Range of Impact" Output
In my experience, presenting a single, precise number (like "342% ROI") destroys credibility in the boardroom. Finance directors know attribution is messy. To secure approval, you must build a model that outputs a realistic range: from direct attribution (conservative) to modeled retention (aggressive).
1. Calculate Hard ROI (The Floor) This is your undeniable minimum return. It relies strictly on tracked codes.
- Pipeline Formula: Multiply Unique Scans by your Landing Page Conversion Rate to determine Qualified Leads.
- Revenue: Multiply Qualified Leads by your Average Contract Value (ACV).
- Use Case: I rely on this for trade shows with clear calls-to-action (e.g., "Scan to book a demo").
2. Calculate Modeled Lift (The Ceiling) This captures the hidden value of customer loyalty.
- Cohort Analysis: Compare renewal rates of clients who received custom corporate gifts against a control group that did not.
- Revenue: (Retention Lift %) × Baseline LTV × Cohort Size.
- Proxy: If internal data is scarce, use brand recall survey scores, but clearly label this Estimated Brand Lift.
3. Apply the Sanity Check Add a row for Industry Benchmark. Compare your output against the standard promotional product ratio (often cited as ~$12 return per $1 spent). If your model claims a 50x return while the industry averages 12x, your inputs are likely flawed.
4. Visualize the Verified Metrics Your final dashboard must display these three outputs to pass a sensory check:
- ROI Multiple: (e.g., "3.5x Spend").
- Payback Period: (e.g., "Breakeven at Month 4").
- The Range Bar: A visual gradient showing the spread between Hard ROI and Total Modeled Impact.
Step 6: Build an ROI Protection Checklist

Calculated ROI collapses when recipients discard items due to poor fit, defects, or logistical friction. You must build a defensive checklist to insure your investment before scaling from 50 to 5,000 units.
1. Enforce Quality Control (QC) Never approve production based on a digital file. Require a physical Pre-Production Sample (PPS). Verify that apparel fabric types match your spec and check logo alignment under natural light.
- Action: Write "AQL 2.5" into your purchase order. This industry standard limits allowable defects (like oil stains or loose threads) to a safe maximum.
- Planning: Order 10% overage specifically for size swaps.
2. Engineer Distribution & Compliance Match the garment to the "reason to wear." A high-volume trade show giveaway prioritizes speed, whereas internal kits should leverage the benefits of employee uniforms, such as team identity and pride.
- ⚠️ Warning: If making sustainability claims, demand GRS or OEKO-TEX certificates. If the factory cannot provide them, remove the claim immediately to avoid greenwashing liability.
3. Execute the Sensory Check Perform this physical "Pass/Fail" inspection on your sample:
- Pass: Stitching is tight, logo edges are crisp, and fabric weight feels substantial.
- Fail: Print cracks when stretched, color shifts, or labels feel scratchy.
**⚠️ Experience Warning:**The "Itchy Label" Factor Always wear the sample for a full day. I once audited a failed uniform campaign where the ROI hit zero because rough neck labels scratched employees' necks. To prevent immediate discard, specify "satin-edge" or "tagless" heat transfers on your PO.
Troubleshooting Common ROI Failures
Even the best models break when reality hits the supply chain. In my experience, most ROI calculations fail not because the math is wrong, but because the inputs were optimistic. Here is how to fix the specific friction points we see teams struggle with.
Problem: “We can’t prove attribution.”
The Fix: Don’t rely solely on direct clicks. I’ve found that 60% of physical impact is "assisted," not direct.
- Use Phygital Tracking: Print a unique QR code or URL (e.g., brand.com/vip) that exists only on the merchandise.
- Add Self-Reporting: Add a "How did you hear about us?" dropdown at checkout.
- Split Reporting: Report Direct Conversions (QR scans) separately from Assisted Conversions (lift in organic traffic).
Problem: “Costs blew up post-approval.”
The Fix: You likely budgeted "Unit Cost" instead of "Total Landed Cost."
- Switch Formulas: Calculate Total Landed Cost (TLC) immediately.
- Buffer Freight: Add 15% for international duties and taxes.
- Kill the Rush: Trigger production 6 weeks early. Rush shipping fees often double the unit cost, destroying margins.
Problem: “No one scanned the QR.”
The Fix: This is rarely a tech failure; it is a placement failure.
- Move the Location: Shift codes from hidden hems to visible Hang Tags or inside neck labels.
- Improve the CTA: Change "Visit Site" to a value-based prompt like "Unlock 20% Off."
Problem: “Quality issues destroy trust.”
The Fix: If the logo peels, the impression count drops to zero.
- Mandate Samples: Never approve a bulk order without a physical Pre-Production Sample.
- Enforce Inspection: Require AQL 2.5 standards on your Purchase Order.
- Measure Wear-Rate: Send a post-campaign survey asking, "How often do you wear this?" to adjust future assumptions.
Problem: “Sustainability lead rejected the program.”
The Fix: They are looking at raw production carbon rather than efficiency.
- Cite the Data: Present the joint PPAI-ASI study showing promo products have a lower carbon impact per memorized impression than digital ads.
- Verify Claims: Clearly distinguish measured sustainability (verified by certifications) from claimed marketing.
Problem: “CFO says the ROI is fake.”
The Fix: Single-point forecasts look suspicious to auditors.
- Show the Range: Present Conservative, Likely, and Aggressive outcomes.
- Log Assumptions: Create an "Assumptions Log." Tie every input to a specific source or invoice.
Conclusion: The Final Verdict
You now have the tools to move from "swag vibes" to a defensible financial model. By calculating your True Landed Cost (TLC), applying CPMI retention scenarios, and enforcing a Phygital tracking plan, you can present a spreadsheet that even a skeptical CFO will respect.
Do not rush into a 5,000-unit order immediately. I recommend starting with a pilot run of 100-250 units to validate your QR scan rates and wash-test durability. Once you prove the payback period is under six months, you can scale with confidence.
Frequently Asked Questions for Roi of Promotional Products
What is a good ROI ratio for promotional products?
In my experience, a "good" return depends entirely on your objective. For direct-response campaigns (like trade show giveaways), I aim for a 3:1 ratio —meaning every $1 spent generates $3 in pipeline value. For client retention gifts, the target often shifts to lifetime value (LTV) preservation rather than immediate cash. If you are seeing anything below a 1.5x return, you are likely overpaying for logistics or selecting items with low retention rates.
How can I track ROI if I can't use QR codes?
If your brand guidelines forbid visible codes, use redemption-based tracking. I advise clients to create a unique "vanity URL" (e.g., brand.com/vip-access) or a specific checkout discount code printed on the packaging insert rather than the item itself. While less granular than individual QR tracking, this method still separates your custom promotional clothing traffic from general organic search traffic in Google Analytics.
Does buying premium brands actually improve ROI?
Yes, because retention drives CPM (Cost Per Impression). When we audited a tech company's swag program, we found that a $50 branded Patagonia fleece was worn 80+ times per year, whereas a $5 generic hoodie was discarded after three washes. Although the upfront cost is higher, the Cost Per Memorized Impression (CPMI) drops significantly because the item remains in circulation for years, not weeks.
Why is my "Total Landed Cost" always higher than the factory quote?
The gap usually lies in drayage and tariffs. A factory quote often only covers the product (FOB). It ignores the 25% Section 301 tariff (for US imports) and the specific "last mile" fees for delivery. I have seen trade show budgets blown apart because the buyer didn't account for the union labor fees required to move pallets from the dock to the booth. Always calculate ROI based on the DDP (Delivered Duty Paid) price, not the factory unit price.